Author: J.P.

  • Device Code Phishing After EvilTokens

    Device Code Phishing After EvilTokens

    Six weeks after Microsoft took down EvilTokens, a detection I’d written for it started firing again. Further investigation led me to a device code phishing platform that appears to serve several customers from one shared backend – one that might predate the takedown.

    How It Started

    Earlier this year I spent a good chunk of time chasing device code phishing emails. My first guess was Tycoon2FA, which LevelBlue had reported experimenting with device code lures. That is, until I started finding public sandbox reports that attributed the indicators I was seeing to EvilTokens, the phishing-as-a-service platform Sekoia wrote up back in March.

    Most of what I pulled out of those emails was the usual disposable stuff – domains that lived for a day, S3 buckets with random names, redirect hops that changed every wave. One thing didn’t change, though: every link started with a TikTok redirect carrying a parameter that had no business being there:

    tiktok.com/link/v2?aid=1988&lzdlang=enFSmPWg&scene=bio_url&target=...

    lzdlang isn’t a parameter TikTok’s link handler normally carries – Hoxhunt’s write-up of the same redirect shows a plain lang=en in that spot – and enFSmPWg isn’t a language code anyone would recognize. It survived every kit rebuild I saw, so I built my detections around it.

    Then on September 22nd, Microsoft announced it had taken down EvilTokens’ infrastructure, and the detection went quiet.

    But you know what they say… everything old is new again. In the world of cyber, this cycle can be measured in months or weeks rather than years or decades.

    After about six weeks of silence, the detection fired again. When I detonated the link in a sandbox it still ended up at Microsoft’s device code login page. Whatever had changed behind the scenes, the goal hadn’t.

    If you haven’t run into device code phishing before, here’s the short version.

    What Is Device Code Phishing?

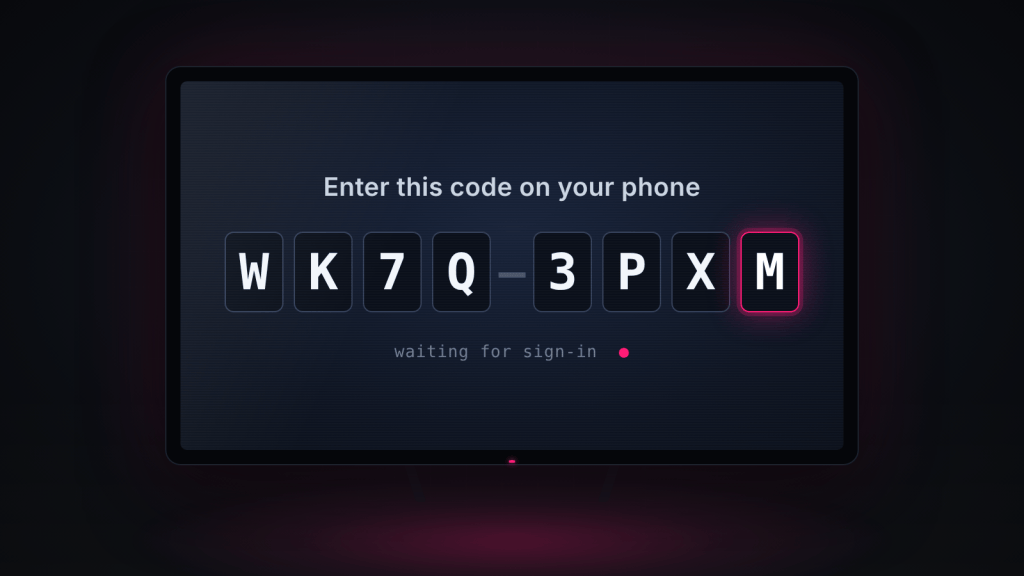
    If you’ve ever signed into a streaming app on a smart TV, you’ve used the device code flow: the TV shows a short code, you type it in on your phone, sign in there, and the TV is logged in.

    Device code phishing puts the attacker in the TV’s seat. The phishing page has the attacker’s backend request a code from Microsoft, the victim enters it on the real microsoft.com/devicelogin webpage and signs in – password, MFA and all. The attacker walks away with a valid access token and a refresh token for their account. Because the victim completed MFA, those tokens already show MFA as satisfied, and the attacker can keep using the refresh token to get new access tokens without ever triggering another MFA prompt.

    The nasty part is that nothing about the sign-in is fake. The victim is on Microsoft’s real login page, answering their real MFA prompt – they just don’t realize they’re approving someone else’s session. The only real constraint for the attacker is time: the code expires 15 minutes after it’s requested, which is why kits now generate it the moment someone lands on the page. Microsoft and Sekoia both cover the mechanics in more depth (see References).

    Following the Redirect Chain

    I detonated one of the new links in a sandbox and followed it hop by hop:

    1. TikTok: tiktok.com/link/v2?...&scene=bio_url&target=... – the profile-bio link handler, which Hoxhunt pointed out back in 2024 doesn’t validate the target at all.
    2. Google DoubleClick: adclick.g.doubleclick.net./pcs/click?CIO7IfjWKRXTAP84695-novemberkd&&adurl=... – an ad click tracker used as a second open redirect. Another wave swapped this hop for NetEase’s enterprise mail redirect (qiye.163.com/api/j/re?c=...) and left everything else alone.
    3. Amazon S3: a page in a bucket with a generated name along the lines of <word>-<word>-<word>-<12 digits>-us-east-1-<xx> (sometimes with dots instead of hyphens) – filler words, a fake 12-digit AWS account number, and a region.
    4. Bunny CDN: the lure itself, on a pull zone with a long, generated, document-themed name (strings like document, review, sign, and folder, plus a run of digits) – a “Microsoft Identity Verification” box with an “I’m not a robot” button. Clicking it fetches a device code from the kit’s backend, copies it to the clipboard, and opens microsoft.com/devicelogin.

    Borrowing TikTok’s and Google’s reputation for the first two hops is the obvious trick. Three less obvious ones matter more if you’re writing detections:

    • A trailing dot. adclick.g.doubleclick.net. is a fully qualified domain name. It resolves fine, but it breaks string matching that expects the hostname to end in .net.
    • Encoding. In some waves the S3 address was hex-encoded, and in older ones it was percent-encoded twice. You can’t match the landing domain until you decode it.
    • The recipient rides in the fragment. Links end with something like #<hex>Farnily=<base64>, where the base64 decodes to the recipient’s address so the page can prefill it. Browsers never send the part after # to the server, so anything watching only server-side requests never sees it. The key changes spelling between waves (Family, Farnily, ...mJmily), and one wave skipped TikTok entirely and put it in plain text on an AWS Lambda function URL (?tomboy=farnily=<email>).

    The page also does nothing interesting until someone clicks. It’s built in the browser from a blob: URL, and the device code is only requested after the “I’m not a robot” click, so a scanner that loads the page and leaves just sees a harmless verification box.

    The Part That Didn’t Change

    Here’s what surprised me. While digging through public sandbox reports, I found a Joe Sandbox analysis from March 27th with the exact same TikTok link – same lzdlang=enFSmPWg, same DoubleClick token, CIO7IfjWKRXTAP84695-novemberkd, down to the character. That chain didn’t end at a device code page at all. It ended at a credential harvester flagged as Morphing Meerkat, the phishing-as-a-service platform Infoblox wrote about earlier this year. IronScales described the same TikTok-to-DoubleClick pattern in August, ending at yet another bot-gated login page. TikTok redirects even show up in Microsoft’s write-up of Tycoon2FA, a completely different kit, although I can’t tie that to this particular template.

    So the redirector isn’t part of any one kit. It’s a delivery template that has carried at least two different kits over more than seven months, and it kept working through a major takedown of one of them. The only part of the DoubleClick token I’ve seen change is the suffix, which looks like a month name (novemberkd). The prefix hasn’t moved.

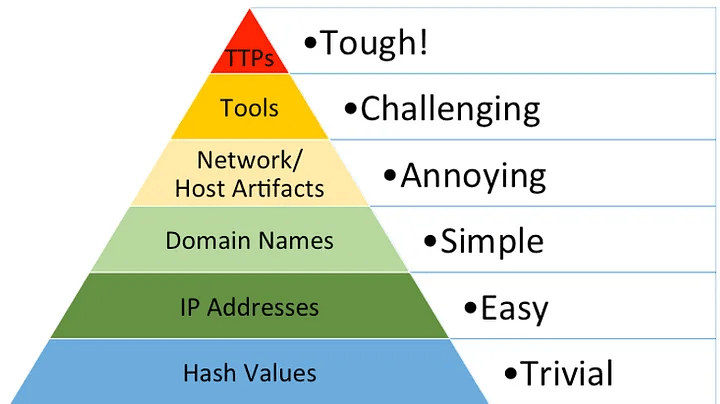
    In my introduction to threat hunting I talked about David Bianco’s Pyramid of Pain, where things like domains and hashes sit near the bottom because they’re trivial for an adversary to change. Strictly speaking, a URL parameter belongs down there with them. This one has been more durable in practice, though, than any domain, bucket, or landing page I’ve tracked in this campaign. My best guess is that whoever maintains the delivery side simply has no reason to touch it – it works, and changing it means rebuilding a template that several customers depend on.

    The lesson I’m taking from this isn’t “hunt for lzdlang” (although you should). It’s that the most useful indicator in a campaign isn’t always the one highest on the pyramid. Sometimes it’s the boring piece the operators forgot they could change.

    Pulling the Thread

    The sandbox run gave me the kit’s backend: v1.quikrq[.]com, a domain registered on September 29th – one week after the takedown. The lure page talked to it through three endpoints:

    GET /static-export/api/visitor/country
    POST /static-export/api/device/start
    GET /static-export/api/device/status/<numeric id>

    The device/start request carried an X-Antibot-Token header with the value bigsnoop_1. If that header sounds familiar, it should – Sekoia documented the same header and the same device/start / device/status design in EvilTokens back in March.

    Searching urlscan.io for scans that requested static-export/api/device turned up five more lure pages that had been submitted over the last few weeks. I pulled the full JSON for each scan, and that gave me another four backend domains, all of which sit behind Cloudflare:

    BackendFront end it servedX-Antibot-Token
    v1.quikrq[.]comBunny CDN pull zonebigsnoop_1
    r3.gamingextol[.]pwAttacker-registered domainlordspartaa
    s3.meazonwaves[.]orgBunny CDN pull zone; Linode Object Storage bucketSNVL23 and a UUID
    c22.turnerandtownsend[.]netAttacker-registered domainGetbusy21
    alliedplpefreezing[.]co[.]ukAttacker-registered domainA UUID

    Two things here jumped out at me.

    First, the X-Antibot-Token. Sekoia described EvilTokens’ version as a SHA-256 hash of a secret, a timestamp, and the word “antibot”, where the secret most likely acted as a license key. These are fixed strings instead, and one backend served two different ones – which looks a lot more like customer keys on shared infrastructure than one operator’s setup. Every backend I’ve checked also sits on its own pair of Cloudflare nameservers, which usually means a separate Cloudflare account – one more reason to read this as a shared platform.

    Second, two of the backend domains are dressed up to look like real businesses. One swaps a single letter for a lookalike (plpe for pipe), the kind of thing that’s easy to read right past. The other borrows a real company’s name under a different TLD – but it was registered in July and sits behind Cloudflare, so it’s an imitation, not the company’s own domain. Either way, check before you block anything close to them.

    The front ends were consistent, too: every one sat behind a Cloudflare Turnstile challenge, built its page from a blob: URL, and several returned their first document with an HTTP 403 status – content and all. Anything that judges a page by its status code writes it off as dead.

    One Counter, Five Backends

    This is the part I keep coming back to. The device/status/<id> calls use a plain number as the session ID, and when I lined the scans up by date, the numbers only ever incremented – across every single backend domain:

    Scan date (UTC)BackendSession ID
    Oct 20alliedplpefreezing[.]co[.]uk462285
    Oct 22c22.turnerandtownsend[.]net475456
    Oct 27s3.meazonwaves[.]org508384
    Oct 28s3.meazonwaves[.]org510265
    Oct 29r3.gamingextol[.]pw523299
    Nov 5v1.quikrq[.]com575839

    Five unrelated backends don’t produce one rising sequence by accident. My assumption is that the backend domains are just relays, and sitting behind them is a central database handing out session IDs. That fits Sekoia’s description of EvilTokens affiliates, whose pages relayed requests to a central API.

    The counter also gives a rough sense of scale. Between scans it climbed anywhere from about 4,000 to 10,000 a day, averaging around 7,000. That’s every page load that asked for a device code – sandboxes and scanners included – so it’s not a victim count, but it’s not a small operation either.

    At roughly 7,000 page loads per day, it would take about 80 days to reach 575,839, which would put the start somewhere around mid-August – a month before the takedown. That assumes the counter started at zero, though.

    There are three ways to read that number: if the counter did start at zero, the platform predates the takedown; if it picked up where an older database left off, it’s a continuation of something older; and if someone seeded it with an arbitrary starting value, it reveals nothing about age at all. On its own, the counter can’t settle the timeline – but as it turns out, it isn’t the only evidence.

    The backend domains themselves add to that. Two of them are aged lookalikes of real businesses, registered through Namecheap well before the takedown – one in September 2025, the other in July 2026. Passive DNS shows both were deliberately set up with Zoho mail, then sat dormant until they were moved behind Cloudflare and pressed into service as backends within a day of each other in late October. A third, the backend from my sandbox run, was registered through Hostinger on September 29th, 2026, one week after the takedown.

    The registration dates don’t tell me when this platform was built. They do tell me the people running it were already holding infrastructure long before September 22nd, and registering fresh domains within a week of the takedown – which suggests they were planning ahead.

    So Is EvilTokens Back?

    Short answer: not exactly.

    As for Tycoon2FA, my original suspect back in August: now that I can see what’s behind these emails, the mechanics don’t fit. Tycoon2FA is an adversary-in-the-middle kit – a reverse proxy that sits between the victim and Microsoft and steals the session cookie – and nothing in this flow proxies a login. The victim signs in on Microsoft’s own page, and the backend’s API lines up with EvilTokens down to the endpoint names.

    Here’s how this platform lines up against what Sekoia published about EvilTokens in March and April:

    EvilTokens (Sekoia)This platform
    Start a codePOST /api/device/startPOST /static-export/api/device/start
    Check statusGET /api/device/status/{id}, dev_ IDs, every 3 secondsGET /static-export/api/device/status/<number>, every second
    Anti-bot tokenSHA-256 of secret + timestamp + “antibot”, computed in PHPFixed string, apparently one per customer
    Lure pageEncrypted HTML decrypted and injected by scriptBuilt from a blob: URL behind Cloudflare Turnstile
    HostingCloudflare Workers, Railway, affiliate PHP relaysBunny CDN, Linode, attacker domains; backends behind Cloudflare

    The API matches EvilTokens path for path, so whoever built this either had EvilTokens’ code or copied its design very closely. Some of the differences even make sense as a port: EvilTokens computed its rotating token in PHP every time the page loaded, and a static page sitting on a CDN has no server code to do that, so a fixed token is what you’d expect. That static-export path name points the same way.

    The hosting tells a similar story. EvilTokens leaned on Cloudflare Workers for its lure pages and Railway for token relay. Cloudflare killed the Workers projects as part of the takedown, and Huntress had already pushed a block on Railway across more than 60,000 tenants. Neither one shows up anywhere in this platform’s infrastructure.

    But the session counter complicates the idea of a simple post-takedown rebuild. It uses a different ID format from EvilTokens, and the evidence in the previous section says the people behind it were already holding infrastructure well before the takedown. As I see it, that leaves four possibilities:

    • An offshoot of EvilTokens, built from its code.
    • An affiliate that grew into its own operation. There’s precedent for this one: Talos wrote up an EvilTokens affiliate panel in July that shared EvilTokens’ API contracts and infrastructure patterns.
    • A competitor that cloned the API.
    • EvilTokens’ own operators, building somewhere new ahead of time.

    The last option doesn’t require any inside knowledge of the takedown. By August, Sekoia, Microsoft, Huntress, and Talos had all published on EvilTokens, and anyone watching their infrastructure get picked apart that publicly would plan for disruption as a matter of when, not if.

    From the outside I can’t tell which. What I am comfortable saying is this: it’s the same design, it serves more than one customer, and it’s still sending. Microsoft’s takedown hit EvilTokens’ infrastructure. It doesn’t appear to have touched this. Microsoft said as much in its own announcement: “The infrastructure supporting EvilTokens has been disrupted, but the model it demonstrated will not disappear with it.”

    It also wouldn’t be the first time. When Europol and Microsoft disrupted Tycoon2FA in March, CrowdStrike saw its daily volume drop to about a quarter of normal, then climb back to pre-takedown levels by the time they published two weeks later – often on domains that had been registered months before the takedown. Takedowns cost operators infrastructure and time, and that matters. They don’t end the operation.

    What to Hunt For

    The first query is a Sentinel query, since that’s where sign-in logs live; the other two are for Defender XDR advanced hunting (swap Timestamp for TimeGenerated in Sentinel).

    Find out who actually uses device code flow.

    If you only do one thing from this post, make it this one:

    SigninLogs
    | where TimeGenerated > ago(30d)
    | where AuthenticationProtocol == "deviceCode"
    | summarize SignIns = count(), Users = dcount(UserPrincipalName) by AppDisplayName, ClientAppUsed

    Assuming that it comes back nearly empty, I recommend blocking device code flow with a Conditional Access policy (the Authentication flows condition) and excluding whatever legitimately needs it. Every detection below chases infrastructure the operators can change. That policy doesn’t care where they move next.

    If you do find a device code sign-in tied to one of these lures, revoke the user’s sessions and refresh tokens. A password reset on its own doesn’t end the attacker’s access.

    Alert on what got delivered, not what got blocked.

    My original detection only matched messages that were already in quarantine, which is great for tracking a campaign and useless for catching the ones that reach an inbox.

    This is the version I run now. It returns one row per message and recipient, so it’s safe to run as a custom detection rule with a soft-delete action:

    EmailEvents
    | where EmailDirection == "Inbound"
    | where DeliveryLocation !in ("Quarantine", "Dropped", "Failed")
    | join kind=inner (
    EmailUrlInfo
    | where Url has "lzdlang=enFSmPWg"
    or (Url has "tiktok.com/link/v2" and Url has "CIO7IfjWKRXTAP84695")
    or Url contains "arnily="
    | project NetworkMessageId, Url
    ) on NetworkMessageId
    | summarize arg_min(Timestamp, *) by NetworkMessageId, RecipientEmailAddress
    | project Timestamp, ReportId, NetworkMessageId, RecipientEmailAddress, Subject,
    SenderFromAddress, SenderMailFromDomain, SenderIPv4, Url, DeliveryLocation

    Note the contains on the fragment key. has only matches whole terms, and the key is glued onto a hex string (...3c3bFarnily=), so has quietly misses it.

    Hunt for your own address in the fragment.

    Plenty of phishing kits besides this one hide the recipient’s base64 address after the #, and almost nothing legitimate does. Base64 encodes your domain three different ways depending on what comes before it, so generate all three first (PowerShell):

    $domain = "@example.com"
    foreach ($k in 0..2) {
    $bytes = [Text.Encoding]::ASCII.GetBytes(("A" * $k) + $domain)
    $b64 = [Convert]::ToBase64String($bytes)
    $core = $b64.Substring(@(0, 2, 3)[$k]).TrimEnd("=")
    $core.Substring(0, $core.Length - 1)
    }

    EmailUrlInfo
    | where Timestamp > ago(30d)
    | where Url matches regex @"#[^#]*(?:<string1>|<string2>|<string3>)"
    | join kind=inner (
    EmailEvents
    | where EmailDirection == "Inbound"
    | project NetworkMessageId, RecipientEmailAddress, DeliveryLocation
    ) on NetworkMessageId
    | summarize Messages = dcount(NetworkMessageId), Sample = take_any(Url)
    by UrlDomain, DeliveryLocation
    | order by Messages desc

    Requiring the # is what makes this usable – without it you’ll drown in marketing and unsubscribe links. Expect a few legitimate senders to exclude by domain, and don’t rely on it alone: EmailUrlInfo doesn’t seem to keep the fragment on every URL.

    Indicators

    Note: Two of the backend names resemble real businesses – one is a lookalike with a single swapped letter, and the other imitates a real company’s name under a different TLD. Double-check before blocking anything close to them.

    Backend API domains

    • v1.quikrq[.]com
    • r3.gamingextol[.]pw
    • s3.meazonwaves[.]org
    • c22.turnerandtownsend[.]net
    • alliedplpefreezing[.]co[.]uk

    Lure pages and redirectors

    • hc-groups-com[.]b-cdn[.]net, hcgroups[.]b-cdn[.]net (Bunny CDN)
    • bucstorxx010[.]us-sea-1[.]linodeobjects[.]com (Linode Object Storage)
    • hmrcuks[.]com, ducohu[.]com, savecey[.]com, oqueebnd[.]com
    • oiyurye[.]com (redirector)

    Naming patterns

    • S3 bucket names: <word>-<word>-<word>-<12 digits>-us-east-1-<xx>
    • Document-themed generated names on b-cdn[.]net (document, review, sign, folder + digits)

    Redirector templates

    tiktok.com/link/v2?aid=1988&lzdlang=enFSmPWg&scene=bio_url&target=
    adclick.g.doubleclick.net./pcs/click?CIO7IfjWKRXTAP84695-<month>kd&&adurl=
    qiye.163.com/api/j/re?c=

    Backend API paths

    /static-export/api/visitor/country
    /static-export/api/device/start
    /static-export/api/device/status/<number>
    /static-export/api/sx/verify

    X-Antibot-Token values: bigsnoop_1, lordspartaa, SNVL23, Getbusy21

    What’s Next?

    There are still a few threads I haven’t pulled. urlquery indexes raw request headers, so searching it for X-Antibot-Token values should show how many customer keys are really out there, and a longer urlscan history should show whether the counter’s August start date holds up. And if EvilTokens’ old dev_ session IDs turn out to be numbered in the same range, that would be about as close to a direct link as I’m going to get.

    This also turned out to be a decent real-world follow-up to my introduction to threat hunting. It started as a simple question – is this detection still covering what it should? – and almost everything I learned came from the hunt, not the alert.

    References

  • An Introduction to Threat Hunting

    An Introduction to Threat Hunting

    In cybersecurity, some of the most interesting work happens outside of responding to alerts or blocking connections. It’s in the quiet work of studying how attackers operate, learning from breaches reported by others, and digging into your own data to uncover things your monitoring tools may have missed.

    That’s what threat hunting is about: going on the offensive to find the adversary who may already be in your environment, looking for their next payday.

    What Do I Mean by “Threat Hunting?”

    Think of your network like your home. Locks on the doors and windows (firewalls, antivirus, IDS) stop most intruders. But a skilled burglar might pick a lock, slip in through an unlocked window, or even walk in with a stolen key. Once inside, they don’t smash things – they move quietly, rifling through drawers and leaving little trace.

    Threat hunting fills that gap. Instead of waiting on alerts, hunters build hypotheses about how an adversary might behave and then actively test those ideas against available data. It is structured, data-driven work focused on behaviors rather than signatures.

    More importantly, threat hunting is a mindset: one that values curiosity, persistence, and the willingness to question assumptions. Every hunt – whether it uncovers malicious activity or not – improves understanding of your environment and strengthens defenses against evolving threats.

    Key Concepts: IOCs and TTPs

    When starting out in threat hunting, you’ll quickly run into two foundational terms: Indicators of Compromise (IOCs) and Tactics, Techniques, and Procedures (TTPs). Understanding the difference is critical because it shapes how you hunt.

    Indicators of Compromise (IOCs):
    IOCs are the digital “breadcrumbs” adversaries leave behind. They can be:

    • File hashes of known malware samples
    • IP addresses used as command-and-control (C2) endpoints
    • Domains or URLs linked to phishing kits
    • Registry keys or filenames associated with persistence mechanisms

    These are valuable for detection because they’re concrete and easily matched in data. But the downside is that they’re also fragile. An attacker can recompile malware to change the hash, spin up a new IP, or register a fresh domain in minutes. IOC-driven hunting often turns into a game of whack-a-mole.

    Tactics, Techniques, and Procedures (TTPs):
    TTPs are the behaviors of adversaries, and they map directly into frameworks like MITRE ATT&CK. They operate on three levels:

    • Tactics: The why – the adversary’s goal (e.g., initial access, lateral movement, privilege escalation).
    • Techniques: The how – specific methods to achieve the goal.
    • Procedures: The details – the exact commands or scripts used (e.g., running procdump -ma lsass.exe).

    TTPs are more resilient for defenders to focus on. While an attacker can swap an IP address instantly, they can’t as easily abandon their need to dump credentials, move laterally, or persist in an environment. Hunting for TTPs means you’re looking at the behaviors that underpin the attack itself, not just the exhaust it leaves behind.

    The PEAK Framework

    Threat hunting isn’t about running random queries until something looks suspicious – it requires structure. One practical framework for approaching hunts is PEAK: Prepare, Execute, and Act with Knowledge.

    via PEAK Threat Hunting Framework on GitHub
    • Prepare:
      This phase is about defining what you’re hunting for and building context. It starts with a hypothesis. For example:
      • Hypothesis: “Attackers may be using unauthorized remote administration tools on endpoints.”
      • Supporting knowledge: Remote tools like AnyDesk or TeamViewer might show up in process creation logs or network traffic.

    Preparation also means understanding your data. Which logs do you have? Where are the blind spots? What does “normal” look like for your environment? Without a baseline, you won’t recognize the anomalies.

    • Execute:
      This is the investigation phase. You translate your hypothesis into queries and search across your data sources. The goal is not only to confirm or refute your hypothesis but also to learn more about the behaviors in your environment.
    • Act with Knowledge:
      Once you’ve executed your hunt, you need to turn findings into action:
      • Escalate confirmed activity to incident response.
      • Write new detection rules or dashboards.
      • Document baselines and anomalies.
      • Share findings with your team to improve collective knowledge.
      • Even a hunt that turns up nothing isn’t wasted – knowing that certain activity is not happening is valuable context for future hunts.

    Types of Hunts

    There are three common styles of hunts, each serving a different purpose:

    • Hypothesis-driven:
      Starts with a focused question. Example: “Are attackers attempting to brute-force service accounts?”
      • These hunts are great for validating intelligence or testing assumptions about adversary behavior.
      • They often rely on known TTPs and can be directly mapped to MITRE ATT&CK.
    • Baseline (exploratory):
      Focuses on establishing what “normal” looks like in your environment, then flagging deviations.
      • Example: A user who typically logs in between 8am–6pm suddenly authenticates at 3am.
      • This type of hunting is especially useful in environments with little historical visibility – it builds the foundation for later hunts.
    • Model-assisted (statistical/machine learning):
      Uses anomaly detection, clustering, or statistical baselining to highlight suspicious activity.
      • Example: Detecting unusually long network sessions that may indicate data exfiltration.
      • While these hunts can uncover subtle threats, they require clean data and careful interpretation – false positives are common if the models aren’t tuned.

    A mature hunting program blends all three: hypothesis-driven hunts to test specific threats, baseline hunts for context, and model-assisted hunts to scale beyond what humans can do alone.

    The Pyramid of Pain

    David Bianco’s Pyramid of Pain is a visual model that explains how much “pain” you impose on attackers when you detect and respond at different levels of indicators.

    via David Bianco’s Pyramid of Pain
    • Hashes: Lowest level. Blocking a malware hash is trivial for attackers to bypass – recompile and move on.
    • IP Addresses: Slightly more effort, but attackers can rotate infrastructure or use VPNs/CDNs.
    • Domains: Harder still – new registrations and DNS updates take more time and money.
    • Network/Host Artifacts: Observable patterns such as unusual URI paths, command-line arguments, or registry modifications. Altering these requires real operational changes.
    • Tools: Blocking tools like Cobalt Strike or Mimikatz forces adversaries to acquire or build alternatives, costing significant effort.
    • TTPs: The top of the pyramid. Detecting behaviors like credential dumping, lateral movement, or data staging forces attackers to completely rethink how they operate.

    The closer your hunts get to the top of the pyramid, the more resilient your detections become. IOC hunts at the bottom are quick but shallow. TTP hunts at the top are harder, but they impose maximum cost on adversaries and give defenders the longest-lasting advantage.

    What Next?

    Threat hunting isn’t about waiting for alarms to sound – it’s about taking the initiative to uncover adversary behavior before it turns into an incident. By understanding the difference between IOCs and TTPs, applying a structured approach like the PEAK framework, and aiming your hunts higher on the Pyramid of Pain, defenders can shift from reactive response to proactive detection.

    Hunting sharpens both technical skills and organizational defenses. Even when a hunt doesn’t uncover active compromise, it adds valuable knowledge about what “normal” looks like in your environment and where your blind spots may be. Over time, that knowledge translates into stronger detections, faster response, and more resilient defenses.

    This post introduced the foundations of hunting – why it matters, the concepts that guide it, and the frameworks that shape it. In part two of this series, I’ll expand on where to find IOCs and TTPs, and show how to apply them in practical hunts. We’ll walk through basic hunting examples to demonstrate how these concepts come together in real-world analysis.

  • Windows Forensics: Prefetch 101

    Windows Forensics: Prefetch 101

    While attending the annual Texas Cyber Summit recently, I watched a talk by Marcus Guevara of Recon Infosec titled “The Best Free Resources to Get Started in Incident Response.”  One of the things he mentioned in that talk is Windows Prefetch – something already built into Windows by default.

    I had never heard of Prefetch before this talk but the premise was really interesting.  Using information that is available within Prefetch, you can begin to establish a timeline of application usage (up to an extent) on a Windows system.

    My mind immediately went to a recent issue I investigated where a spear phishing attack successfully convinced several members of senior management to not only open an email and click on a link, but also download and open a PDF file.  I also thought back to several past incidents where users had encountered the classic virus scam pop-up, trying to convince them that their system was infected.

    I come from a networking background so my first inclination is usually to look at our firewall or our SIEM to see what IPs are connecting to and from the system.  Next I usually look at Windows event logs from that system – again through the SIEM.  Using Prefetch information, though, it sounded like I would be able to gain additional insight directly from the endpoint itself.

    What Even Is Prefetch Anyway?

    Prefetch was introduced back in ye olden times with the release of Windows XP in the year 2001.  (If you are reading this and you remember when Windows XP was released, please remember to stand up and move around every once in a while before your back locks up…like mine will shortly.)

    The purpose of Prefetch was to speed up the boot-up of the system and reduce the amount of time it took applications to load.  It does this by storing some basic information about the resources needed by commonly-used executable binaries run on the system into a file so that those resources can be pre-emptively loaded into memory before they are needed.

    Side note:  Within the context of this article, I am referring exclusively to Windows Prefetch.  Prefetch as a concept is used in several other contexts throughout other environments (such as software engineering), and I won’t be referencing any of those here.

    Configuring Prefetch

    The configuration for Prefetch is accomplished with a key value stored in the following Windows registry hive:

    HKEY_LOCAL_MACHINE\SYSTEM\CurrentControlSet\Control\Session Manager\Memory Management\PrefetchParameters

    The default configuration for the EnablePrefetcher key is 3.  This enables Prefetch for both boot-up and application use.  You can modify the behavior of Prefetch by double-clicking on EnablePrefetcher and changing the Value data field to one of the following values:

    0Disables Prefetch entirely
    1Enables Prefetch for applications only
    2Enables Prefetch for boot-up only
    3 (default)Enables Prefetch for both boot-up and applications

    What and Where Are Prefetch Files?

    When Windows creates a Prefetch file, that file is saved to the %systemroot%/Prefetch folder (the common literal path for this is C:\Windows\Prefetch).  You can quickly reach this location by opening a Run window by pressing the Windows key + R, then in the Open: field type in prefetch and click OK.

    These files have a .pf file extension and are stored in an encrypted format, so they are not immediately readable with something like Notepad – they have to be opened with specific tools.

    Beginning with XP, Windows was able to store up to 128 Prefetch files.  Once Windows 8 came along this number was upped to 1,024 Prefetch files.  Once that limit is reached, Windows will automatically delete files from the Prefetch folder.

    The name of each Prefetch file will begin with the name of the binary as well as an eight-character hash of the location where the file was executed from.  As an example, here are a few Prefetch file names from my system:

         CHROME.EXE-5A1054B7.pf
    CMD.EXE-4A81B364.pf
    NOTEPAD.EXE-D8414F97.pf

    You may notice that some applications have multiple different files with very similar hash strings.  There are a few reasons why this might happen.

    One of the possible causes for this is due to the fact that this hashing function is actually a two-part process.  The first hash that is generated is based on the full file path of the binary – i.e., C:\Windows\System32\rundll32.exe – which is converted into a unicode string to which the first  hashing function is applied.

    The second hashing function is calculated based on the case-sensitive file path and command line string (including arguments) that the binary is being run with.  This is very likely the source of the discrepancy.  Running CMD.exe will produce a slightly different hash than, say, cmd.exe or even Cmd.exe.

    It may also be that a binary with the same name is running from a different location, such as C:\temp.  This could be a sign of something malicious running on the system.  Aside from decrypting the file itself or running a script to reverse the hash, there also exists a pre-generated lookup table of Prefetch hashes which is available from the Hexacorn blog here.

    Prefetch File Contents

    Given that Prefetch files are intended to reduce the amount of time that it takes for applications to load, you probably wouldn’t be surprised to learn that they contain a list of directories and files referenced by a given executable, with their full file paths.

    Slightly more useful, though, is metadata on the executable itself – its file size, creation date, modified date, date last accessed, date last run, an eight-character hash, and the number of times the executable has been run.

    Below is an example of a Prefetch file that I got off of a fresh Windows 11 virtual machine that I spun up for this:

    Created on: 2023-10-22 02:53:06
    Modified on: 2023-10-22 02:53:06
    Last accessed on: 2023-10-22 02:54:00

    Executable name: NOTEPAD.EXE
    Hash: 2486F8A8
    File size (bytes): 128,820
    Version: Windows 10 or Windows 11

    Run count: 1
    Last run: 2023-10-22 02:53:04

    Volume information:

    #0: Name: \VOLUME{01d9eb913362ed3f-2c339f40} Serial: 2C339F40 Created: 2023-09-20 07:08:04 Directories: 39 File references: 198

    Directories referenced: 39

    00: \VOLUME{01d9eb913362ed3f-2c339f40}\PROGRAM FILES
    01: \VOLUME{01d9eb913362ed3f-2c339f40}\PROGRAM FILES\WINDOWSAPPS
        *** Output omitted for brevity ***
    37: \VOLUME{01d9eb913362ed3f-2c339f40}\WINDOWS\SYSTEM32\EN-US
    38: \VOLUME{01d9eb913362ed3f-2c339f40}\WINDOWS\WINSXS\AMD64_MICROSOFT.WINDOWS.COMMON-CONTROLS_6595B64144CCF1DF_6.0.22621.2215_NONE_270D72677387DFC3

    Files referenced: 142

    00: \VOLUME{01d9eb913362ed3f-2c339f40}\WINDOWS\SYSTEM32\NTDLL.DLL
    01: \VOLUME{01d9eb913362ed3f-2c339f40}\WINDOWS\SYSTEM32\C_1252.NLS
        *** Output omitted for brevity ***
    140: \VOLUME{01d9eb913362ed3f-2c339f40}\WINDOWS\SYSTEM32\WINDOWS.UI.CORE.TEXTINPUT.DLL
    141: \VOLUME{01d9eb913362ed3f-2c339f40}\WINDOWS\SYSTEM32\TWINAPI.DLL

    Tools for Analyzing Prefetch Files

    One of the most widely-recommended tools for working with Prefetch files is called Prefetch Explorer Command line (PECmd) by Eric Zimmerman.  PECmd is a command line tool (I bet you never would have guessed that by the name) which is extremely useful for processing .pf extension files.  You can use PECmd to parse single files or entire directories, and you can output the results of this to multiple formats such as JSON, HTML, and CSV for analysis in other tools.

    Another tool that I’ve found is WinPrefetchView from NirSoft.  This offers a graphical pointy-clicky interface for those who aren’t yet as comfortable with command line tools.  Just like PECmd, WinPrefetchView can work with either individual files or entire directories, and you can also save your outputs into other formats – in this case XML, CSV, and HTML.

    References

    What Are Prefetch Files in Windows?  Are They Important?  |  The Tech Advocate
    https://www.thetechedvocate.org/what-are-prefetch-files-in-windows-are-they-important/

    Prefetch Files in Windows  |  Geeks for Geeks
    https://www.geeksforgeeks.org/prefetch-files-in-windows/

    Prefetch Hash Calculator + a hash lookup table  |  Hexacorn
    https://www.hexacorn.com/blog/2012/06/13/prefetch-hash-calculator-a-hash-lookup-table-xpvistaw7w2k3w2k8/

    PECmd  |  Eric Zimmerman
    https://github.com/EricZimmerman/PECmd

    Eric Zimmerman’s Tools  |  Eric Zimmerman
    https://ericzimmerman.github.io/#!index.md

    WinPrefetchView  |  NirSoft
    https://www.nirsoft.net/utils/win_prefetch_view.html

  • Network Fundamentals: The OSI Model

    Network Fundamentals: The OSI Model

    Networking is one of the fundamental pillars of computing.  Networks allow us to communicate data across a global scale in a way which largely seems (to me) to be taken for granted.  Networking, even on the most basic of levels, is a skill that will aid anyone in technology will find valuable to their career – from system administrators, to help desk, to programmers.

    I will be starting off with a simple description of what networking is, then going through some basic terminology, introducing the OSI model, describing local versus routable network traffic, some basic network troubleshooting tools, and finally ending with a high-level overview of some of the most basic network protocols such as HTTP and DNS.

    My hope is that – even if I don’t inspire the same level of interest in you that I have with networking – you do come away learning something.

    What is Networking? 

    Networks allow two devices to talk to each other and transmit application data, whether they’re as close together as being in the same room or as far as being half a world apart.  Accomplishing this involves a basic, standardized process for how two devices – with no prior knowledge of the other’s location – can send information back and forth.

    At its highest level, the Internet is a network.  This is the one network that I’m sure everyone reading this post is aware of.  On a more granular level, though, a network can be as small as a Bluetooth device connecting to your phone (known as a Personal Area Network, or PAN).  If you have a modem or router at home that allows multiple devices to connect through your Internet Service Provider, you have a Local Area Network (LAN).

    In order to accomplish this, we use network devices.  The most common of these are the switch and the router.  Earlier devices like hubs and bridges did once exist, but have mostly gone the way of the dinosaur.  The primary differences between these devices is found in how they handle network communications, also known as traffic.

    Switches aggregate incoming traffic from each physical port (also known as an interface) and forward it on to its destination.  If the intended recipient is directly connected to the same switch as the sending device, then the switch will forward that traffic directly from the sender to the destination device.  If the recipient is not directly connected to the same switch as the sending device then one of two things happens:

    • The switch has learned where the recipient is connected on a neighboring network device (switch or router) and forwards that traffic to the neighboring network device; or
    • The switch has never seen the intended recipient before, does not know where it is located on the network, and sends the traffic out of every interface except the interface that traffic was received on.  This is known as a flood.

    Routers, on the other hand, are meant to take network traffic from switches destined to a different network than the originating network.  As an example, if you were to open a web browser and open google.com, your network router would take that traffic and forward it out to the internet for Google’s network to respond to.  I will get more into this a little further down when I go over local versus routable network addressing.

    Some routers – either home routers which are manufactured this way or business-class routers which are specifically configured this way – can service the same network from multiple interfaces.  For the sake of simplifying things in this post I will refer to routers specifically when traffic needs to be forwarded between two separate networks.

    The OSI Model

    When dealing with an abstract principle such as networking, it is helpful to have a logical representation to visualize concepts.  This is where the OSI model comes in.

    Back in the late 70s, work began on multiple fronts to establish a standard model for networks which resulted in several publications.  Possibly the most well-known of these is the Open Systems Interconnection – Basic Reference Model, colloquially known as the OSI model.  This was, according to Wikipedia anyway, first defined in 1978 by Hubert Zimmerman before being published in 1984 by the International Standards Organization as standard ISO 7498.  It is regularly referenced in day-to-day network administration and is one of the most important basic principles to learn in networking as a whole.

    I would be remiss at this point if I did not also mention the Internet Protocol Suite, also known as TCP/IP, but sometimes also referred to as the TCP/IP model.  The Internet Protocol Suite is not really a model so much as it is an architecture which specifies how data is packetized, addressed, transmitted, routed, and received over a network.  Comparing the TCP/IP architecture with the OSI model is a bit of a nonstarter simply because they are two sides of the same coin.  Each compliments and builds upon the other.  Both share some of the same principles.  The most important difference is that the OSI model provides a more comprehensive breakdown of networking concepts while TCP/IP focuses on the nuts and bolts of implementing various protocols.

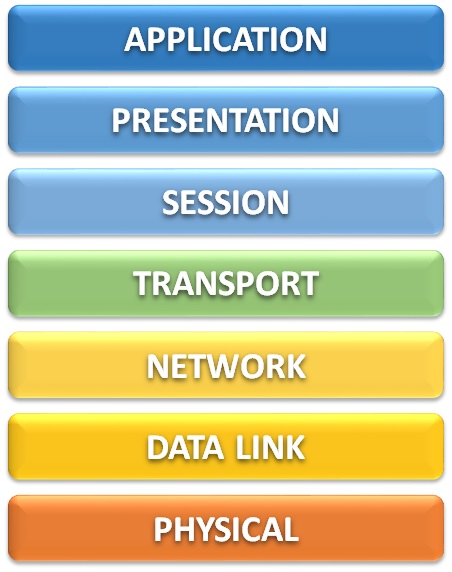
    The OSI model consists of seven layers arranged vertically in a stack, beginning on the bottom with Layer 1 and ending at the top with Layer 7.  These layers logically organize networking principles into separate groups in a way that is relatively easy to comprehend.  By understanding each of these layers, we can begin understanding both how TCP/IP architecture functions, as well as methodologies for troubleshooting connectivity when issues arise.

    This model can be broken down into two primary groupings – the Lower Layer (consisting of layers 1 through 4) and the Upper Layer (consisting of layers 5 through 7).

    The lower layers of the OSI model are the bread and butter of network administration.  These layers directly address how data flows across, into, and out of a network to other devices on that network or even out to the internet.

    On the other hand, the upper layers of the OSI model detail how that data is sent to and from the user’s application, as well as how that data is presented to the user – i.e., breaking down an email into multiple individual data packets, reassembling all of those packets in the correct order on the other side without losing any information, and presenting that email on the recipient’s inbox.

    Layer 7 – Application

    You could probably guess what this layer is, and you’d probably be right. The application layer consists of the programs that we as users interact with directly, such as web browsers or email clients. This also includes non-graphical network protocols which may be used from the command line or called in some other way (i.e., by the computer’s operating system) such as DHCP, FTP, and SNMP.

    Layer 6 – Presentation

    Presentation is a bang-on description of what the presentation layer does. This layer is responsible for the translation, compression, and encryption of application data before it is fed down to the lower-level layers, and again performs the reverse of these functions when fed receiving data by the session layer. The key benefit of this is that the presentation layer is in charge of ensuring that the recipient can understand what the sender is transmitting.

    Because not all data needs to go through a modification process to make data readable to a recipient, the presentation layer is sometimes skipped or otherwise performed by the application layer instead.

    Layer 5 – Session

    As data moves across the network, a conversation needs to be started between the sender and the receiver. This conversation is established, maintained, and eventually torn down by the session layer through the use of Application Program Interfaces (APIs). These APIs include NetBIOS, TCP/IP sockets, and Remote Procedure Calls (RPCs).

    The API conversations managed by the session layer differ from the TCP connections managed by the transport layer below in that the session layer manages these conversations on behalf of the application (the upper layers of the OSI model), whereas the transport layer manages its conversation on behalf of the network (the lower layers of the OSI model).

    Layer 4 – Transport

    Although I have already described the transport layer as one of the lower-level layers above, some of its functions could be said to be better described as upper-layer functions. If you look at all of the transport layer’s functionalities, though, it definitely skews more toward the lower (network) layers of the OSI model than the upper application layers.

    The transport layer primarily deals with the segmentation, packaging, and reassembly of data across the network through the connection-oriented Transmission Control Protocol (TCP) and connectionless User Datagram Protocol (UDP). It also insures the reliable delivery of quality network data by verifying that transmissions are received without errors and handling mismatches in speed to avoid overwhelming the receiver.

    Layer 3 – Network

    When I get asked what I do at work I usually try to summarize it somewhere along the lines of “I make sure that the computers can talk to each other.” The network layer is where the nuts and bolts of this communication really begin because this is where IP addresses come into play.

    Without an IP address — regardless of whether that is an IP version 4 address or an IP version 6 address — your computer isn’t going to get very far when attempting communication. When you attempt to browse to http://www.google.com, for instance, what really happens is that some DNS server translates the domain name (google.com) to an IP address (8.8.8.8).

    IP version 4 (IPv4) addresses consist of four sets of numbers between 0 and 255, called octets, which are separated by decimal points. There are public IP addresses which can be reached by anyone on the internet and private IP addresses which are reachable only from your local network. Of the private IP addresses, these are divided up into several groups known as classes — class A, class B, and class C being the most important. These directly relate to the maximum potential size for a network through something known as subnetting.

    IP version 6 (IPv6) addresses are much longer than IPv4 addresses and are made of up of hexadecimal characters — that is, numbers from 0 to 9 and letters from A to F. These addresses are 32 characters long and are broken up into eight groups called words which are separated by colons (:). They look something like this:

         2001:0db8:3333:4444:5555:6666:7777:8888

    Another very important function of the network layer is routing. Whatever your IP address is on your device, you will also have something called a gateway. If your computer is trying to communicate with another device outside of its subnet, then it will send that data to your gateway’s IP address. Your gateway will then route that traffic along the network based on its configuration.

    I may be a bit biased on this, but I feel like the data link layer is the most important of the lower layers.  This is where all the good stuff happens.  If the lower layers of the OSI model were a high school group project, layer 3 would be the jock that gets all the attention while layer 2 is the awkward kid that does all the actual work.

    Every device which connects to a network uses what is known as a Network Interface Controller, or NIC.  These NICs are technically a layer 1 component but they also contain what is arguably the most important component of the data link layer – a Media Access Control (MAC) Address.

    Each NIC has a MAC address which is assigned by the manufacturer.  (Sometimes these addresses are referred to as a burned-in address rather than a MAC address; it’s the same thing.)  These MAC addresses consist of 16 bits which are rendered in hexadecimal – that is, the only valid characters are 0 through 9, and A through F.

    MAC addresses can be presented in multiple logical formats which are usually divided into either six groups of two characters or three groups of four characters, often separated by a dot, colon, or hyphen.  The exact formatting of these MAC addresses doesn’t really matter too much.  They are written that way for much the same reason that phone numbers are written the way they are: for human benefit.  There are some exceptions to this in that the operating systems of network devices often require MAC addresses to be entered in a specific, consistent format.

    Layer 1 – Physical

    This layer consists of the physical wires and hardware necessary for computer networking.  That includes ethernet cables and network devices such as switches, routers, and firewalls.  Anything you can literally put your hands on, or any component piece of those such as internal electronics, is usually considered layer 1.

    Also included in layer 1 are the electrical impulses which are transmitted across the conductor wire, whether that is copper, fiber, or something else entirely.  (There is, I am given to understand, an actual RFC out there which defines the transmission of data across wet string, not to mention the well-known RFC for transmission by carrier pigeon.)

    Considerations

    In general, network traffic flows downward from Layer 7 to Layer 1 on the sending device, then upwards from Layer 1 to Layer 7 on the receiving device.  This is due to the way that operating systems break down application data into packets, frames, and ultimately the zeroes and ones which get transmitted across the wire.  Then, on the other side, the receiving device has to be able to know how to interpret those zeroes and ones, then reassemble them up the stack into application data.

    One thing to keep in mind is that the OSI model is not perfect.  It is a conceptual model.  You could visualize the OSI model as a 7-layer dip and not be entirely wrong.  Just like that same game day chip dip, you may not always hit every single layer in a single bite.  That’s okay.  Again…it’s a concept, not a ruleset.

  • Cisco ISE: Adding Network Devices

    In ISE, switches are referred to as a Network Access Device (NAD).  Other NAD devices include wireless LAN controllers and VPN concentrators.  NADs are responsible for enforcing ISE policies on devices connecting to the network with MAB authentication via RADIUS, as well as authorization of remote device administration over SSH via TACACS+.

    Before a switch will act as a NAD, it needs to be added to ISE as an object and configured for use as both a RADIUS and TACACS server with a shared key.

    To add a new switch to act as a NAD in ISE:

    1. Navigate to Administration > Network Resources > Network Devices.
    2. Click the + Add button.
    3. Configure the following attribute fields:
      1. Name: Type in the hostname of the switch.
      1. IP Address:         Type the management IP address of the switch.
      1. Location:            Click the drop-down and select Location.
      1. IPSEC:                 Click the drop-down and select Is IPSEC Device.
      1. Device Type:      Click the drop-down and select Device-Type.
    4. Click the checkbox next to RADIUS Authentication Settings and configure the Shared Secret.
    5. Click the checkbox next to TACACS Authentication Settings and configure the Shared Secret.
    6. Click the Submit button to complete the configuration.

    To edit the configuration of an existing device:

    1. Navigate to Administration > Network Resources > Network Devices.
    2. Click the checkbox next to the device to configure.
      Tip:  You can click the Show: drop down box and select Quick Filter option to search for a specific device using the Name or IP column.
    3. Click the Edit button.
  • Exam Review: Cisco SCOR 350-701

    I have been putting off writing this review for a year and a half now.  I did finally pass the SCOR exam and earn my CCNP Security certification, but only after four attempts and more hours than I care to try and estimate.  Don’t get me wrong – this is the first time I’ve ever framed a certification and hung it in my cubicle because I remember vividly what I went through to attain it.  I’m very happy and proud to have passed, but it seriously burned me out on studying for exams.

    After I passed the SISE exam in July of 2020, I immediately began studying for the SCOR exam.  My first attempt at it was in late September.  The next three attempts were all in the month of October, with my final passing result coming on October 24th.

    A major problem I had was specifically due to the official Cisco course guide being very scattered and irrelevant to the exam material, as well as my own lack of hands-on experience with any of the technologies covered by the exam apart from Identity Services Engine.  I also had some experience in studying for the retired IINS exam which included ASAs and VPNs, but I still do not have any experience with ESAs, WSAs, Umbrella, FirePOWER, or any of the other solutions covered by the SCOR.

    The greatest asset I had during my SCOR studies was a study group that was arranged by Martin B.(@martinmbne / mbne.net) for several of us who were all pursuing the CCNP Security certification.  We all shared our study notes, white papers we’d found, our wins, our losses, and they were a constant source of inspiration and motivation for me.  I would be remiss if I didn’t also mention Carl Zellers (@cfzellers4) and Kim Pedersen (@kpjungle / packet-forwarding.net) for offering their support and commiserations as I worked through my many exam attempts.

    Score Results

    This exam frustrated me for many reasons. One of those reasons is how close I came to passing on my second and third attempts. I’ve included the exam results of all of my attempts below for transparency.

    Exam TopicAttempt #1Attempt #2Attempt #3Attempt #4
    Security Concepts 80% 76% 84% 88%
    Network Security 52% 67% 67% 81%
    Securing the Cloud 67% 73% 80% 100%
    Content Security 64% 64% 71% 79%
    Endpoint Protection & Detection 70% 70% 50% 70%
    Secure Network Access, Visibility & Enforcement 80% 87% 80% 87%

    Study Materials and Cost

    For preparation, I used the following resources:

    CCNP and CCIE Security Core SCOR 350-701 Official Cert Guide (Cisco Press) – Cost: $73.60
    The nicest thing that I have to say about this book is that it I highly recommend it, at least as a starting point. You need to understand up front that this book does not do an adequate job of covering the exam material in enough detail — and honestly, doesn’t cover some exam material at all. You will not pass the SCOR exam solely by reading this book. If anything, my personal opinion is that this book gets you less than half the way there.

    Implementing and Operating Cisco Security Core Technologies (SCOR) v1.0 (Cisco Learning Library) – Cost:  $500
    Just like with the SISE exam, I’ve listed the retail cost here, but since I used Cisco learning credits this resource ended up being free to me.  I would still recommend it if you can afford it – or have learning credits available for use.  It makes a good companion to the printed materials and includes practice questions which aren’t carbon copies of those found in the OCG practice test.

    CCNP and CCIE Security Core SCOR 350-701 Complete Video Course (Pearson LiveLessons) – Cost: $129.89
    This video series is given by the same person who authored the OCG book, Omar Santos. I went into this with high expectations of exam-relevant content. If I had to do it again…I’m not sure I would invest in this product. About the only useful thing I got out of it were the practice test questions.

    Integrated Security Technologies and Solutions – Volume I: Cisco Security Solutions for Advanced Threat Protection with Next Generation Firewall, Intrusion Prevention, AMP, and Content Security (Cisco Press) – Cost: $56.28
    Integrated Security Technologies and Solutions – Volume II: Cisco Security Solutions for Network Access Control, Segmentation, Context Sharing, Secure Connectivity and Virtualization (Cisco Press) – Cost: $56.28
    After my second exam attempt, I think it was, these two books were recommended to me as resources by members of my study group. These are great resources. Again, you will not pass the exam with only these books, but I highly recommend them as a supplement to the OCG.

    Network Security Technologies and Solutions (Cisco Press) – Cost: $91.68
    I found this book on my own simply by browsing through the Cisco Press catalog of publications. It was not recommended to me, and I don’t believe anyone else in the study group used it. If you can afford to add this to your studies then I do recommend purchasing it. That said, if I had to choose only between this and the two volumes listed above, I’d pick those two.

    Exam Fees – Cost: $1,600.00
    Pretty self-explanatory here. Each exam attempt was $300, and I took it four times before I passed.

    In Retrospect…

    I spent a long time cursing the name of Omar Santos after this exam. I recently saw his name as one of the listed authors on a Cisco Press book that I was thinking about buying and immediately decided against it.

    In hindsight, I don’t know what kind of situation this exam was developed under…the material was the worst of any Cisco exam I have ever taken, but how closely did Cisco work to ensure that the material accurately reflected the exam?

    I don’t know, and I shouldn’t take that all out on Omar. I don’t even know the guy.

    My pockets are a lot lighter now and I’m fairly positive that I gained several new grey hairs (probably also lost a few permanently) as a result of this exam. But like I said before…I feel a great sense of accomplishment now that I have this certification, and I have gotten a fair amount of recognition from people I work with for having attained it.

    What’s Next?

    To be frank, I’m not really sure. I did take (and fail) the ENWLSD exam last year, mostly just because I thought it would be something quick and easy. I’m applying for some positions doing network security which require knowledge of Palo Alto firewalls and IPsec site-to-site VPNs, though, so I may pursue either the PCNSA or SVPN exams in order to bolster my knowledge with those solutions.

    I’m also roughly halfway through an associates degree program now which has severely limited my free time that I once used to study for certifications…but that’s not a terrible problem to have either.

  • SolarWinds Orion NPM: Configuring Cisco Hardware Health Pollers

    While troubleshooting an issue with a 4506 switch recently, I discovered an interesting discrepancy: Orion was reporting a critical hardware issue on the switch, but the switch itself didn’t seem to have any idea that anything was wrong.

    The exact error I was seeing was that a supply voltage sensor for a fiber switchport interface was in a critical state.

    A bit of Google-fu revealed multiple publications from the SolarWinds Customer Success Center which explained, in short, that Cisco devices may trigger false or invalid hardware health state alerts in the Orion Web Console due to a misconfiguration of the Hardware Health Poller settings.

    By default, it seems that Orion uses the CISCO-ENTITY-SENSOR-MIB.  The publications from SolarWinds state that this issue exists on the Cisco 3850 and 4500-series “and many more,” which is unhelpfully vague.  There is a link to another article hidden behind a login form that seems to insinuate that there is also a known problem with Cisco 3650 switches incorrectly reporting temperatures because of the same issue.

    The fix is to configure Orion to poll hardware health using the CISCO-ENVMON-MIB instead.  I attempted to research why this fixes the issue without much success.  The closest I got to finding a reason why the ENVMON MIB works when the ENTITY-SENSOR MIB does not was this sentence from an undated and deprecated Cisco document for the UBR series router:

    In Cisco IOS Release 12.2BC and later releases, use this MIB instead of CISCO-ENTITY-SENSOR-MIB for temperature monitoring.

    This seems to insinuate that the CISCO-ENTITY-SENSOR-MIB was deprecated following the release of Cisco IOS 12.2BC, but that’s largely an assumption on my part.  I have attempted further research without any success.

    The Resolution

    To reconfigure the Hardware Health Polling setting for a specific node, follow the steps below:

    1. Log into the Orion Web Console.
    2. Click Settings > Manage Nodes.
    3. Locate and select the desired node.
    4. Click Edit Properties.
    5. Scroll down to the Hardware Health Polling section near the bottom of the page.
    6. Click the Preferred Cisco MIB drop-down menu and select CISCO-ENVMON-MIB.
    7. Click Submit.

    At this point you can either wait for Orion to poll the node itself automatically or initiate a manual poll.  This should resolve the issue on the node.  However, if you would prefer to change the default behavior of Orion to use the ENVMON MIB instead, follow these steps:

    1. From the Orion Web Console, click on the Settings > All Settings menu.
    2. Find the Thresholds & Polling section, then click Polling Settings.
    3. Scroll down to the Hardware Health Polling section near the bottom of the page.
    4. Click the Preferred Cisco MIB drop-down menu and select CISCO-ENVMON-MIB.
    5. Click Submit.

    Alternatively there are two further workarounds that can be used if reconfiguring the MIB does not resolve the issue:

    • Disable the sensor(s)
    • Override the sensor(s)

    To override the sensor thresholds:

    1. From the Orion Web Console, click on the Settings > All Settings menu.
    2. Find the Node & Group Management section, then click Manage Hardware Sensors.
    3. Locate and select the desired sensor(s), then click Edit Thresholds.

    From this point, you can change the sensor status state and/or specify a new threshold.

    Additional Thoughts

    With no further information on whether this issue is caused by Cisco IOS version, hardware model, or both, I have elected to keep the global setting configured for its default value of CISCO-ENTITY-SENSOR-MIB and change the setting manually on a device-by-device basis until I have a better understanding of what exactly is going on.

    It would be helpful if someone – anyone – would publish some sort of guidance about the details of this issue.

    References

    Inaccurate Cisco hardware health is in warning or critical state | SolarWinds Customer Success Center
    https://support.solarwinds.com/SuccessCenter/s/article/Inaccurate-Cisco-hardware-health-is-in-warning-or-critical-state?language=en_US

    Change the preferred Cisco MIB for hardware health in NPM | SolarWinds Customer Success Center
    https://support.solarwinds.com/SuccessCenter/s/article/Change-the-preferred-Cisco-MIB-for-hardware-health-in-NPM?language=en_US

    Change the MIB used for polling hardware health statistics | SolarWinds Customer Success Center
    https://documentation.solarwinds.com/en/Success_Center/orionplatform/Content/Core-Changing-MIB-Used-for-Polling-Hardware-Health-Statistics-sw1607.htm

    Chapter 3, MIB Specifications | Cisco
    https://www.cisco.com/en/US/docs/ios/zz_trash/CableCmds/ubrmib3M.html#wp1029199

  • Exam Review: Cisco SISE 300-715

    Back in late 2019, I made a decision that I was going to attempt to take the Cisco IINS 210-260 and SISAS 300-208 tests prior to the “Certpocalypse” of exams retiring in late February 2020.  My thinking was two-fold:

    1. My existing CCNA Cybersecurity Operations certification would be retitled as a “Cisco Certified CyberOps Associate.”  By passing the IINS exam I would be able to retain my CCNA status within the Security domain.

    2. The new exams being released after February 2020 would consist of a core exam and one or more specialty exams.  If I passed the SISAS test prior to its expiration, I would then only need to take one test – the SCOR – to convert that result into a CCNP level certification.

    Unfortunately, spoiler alert, I slacked off on my studies and did not make the progress that I had hoped I would.  I did eventually sit for the IINS exam but failed by a matter of just under 50 points.  Close, but no cigar.

    I sat idle for two or three months and brooded over my failure.  It had broken a streak of seven successful exam attempts in a row and I was miffed.  If only I had gotten three, maybe four more questions correct…

    Eventually I got over myself.  We had Cisco learning credits due to expire at work so I invested them heavily into the new exams.  I decided that I was going to make my goal of getting the CCNP Security certification come true, and I would do it prior to my year-end review – which is in October of this year.

    I selected the SISE 300-715 exam to begin with rather than the SCOR exam.  The SISE is one of several specialty exams for the new CCNP Security certification, and the updated version of the SISAS exam I was planning to take originally.  I chose this specialty specifically because I use Cisco ISE daily at work and I thought it would be a cake walk.

    What I learned, however, is that Cisco ISE has a lot more to offer than what we use it for, and I quickly began to feel like I was in over my head.

    Score Results

    First of all, I’ll admit that I’m not necessarily proud of the score or my individual topic results, but since the Cisco Press OCG book doesn’t release until October I’m not going to look a gift horse in the mouth on this one.

    There were several topics (like Web Auth and Guest Services) which were completely alien to me on a first pass over the material.

    My score breakdown by topic:

    • Architecture and Deployment – 67%
    • Policy Enforcement – 60%
    • WebAuth and Guest Services – 44%
    • Profiler – 86%
    • BYOD – 67%
    • Endpoint Compliance – 100%
    • Network Access Device Administration – 67%

    Study Materials and Cost

    For preparation, I used the following resources:

    CCNP Security SISAS 300-208 Official Cert Guide (Cisco Press) – Cost:  $105.23
    I messed up on this one by purchasing the book as a standalone item from Amazon back in 2019, which didn’t give me access to the practice test.  I ended up buying the e-book and practice test bundle separately in 2020.  If you absolutely, positively, have to take the SISE exam prior to October 2020, then this is for you.  Otherwise…wait for the revised edition to come out.

    CPLL-SISE-V3 Implementing and Configuring Cisco Identity Services Engine (Cisco Learning Library) – Cost:  $500
    I’ve listed the retail cost here, but since I used Cisco learning credits, this resource ended up being free to me.  I’d recommend it if you can afford it – or have learning credits available for use.  It makes a good companion to the printed materials and includes practice questions which aren’t carbon copies of those found in the OCG practice test.

    CCNP Security Cisco Identity Services Engine SISE 300-715 Complete Video Course (Pearson LiveLessons) – Cost:  $399.99  $129.89
    Cisco Press was running a discount on this video series for the new exams when I purchased it, so your mileage may vary.  I try to use as many different materials sources as I can, as having the same topic explained from multiple viewpoints can often help me assimilate that knowledge better myself.  For the cost I was happy with this course – although, since I only purchased it about 30 days before my exam, I did not end up making it all the way through the course.

    Network-Node.com – Cost:  Free
    Katherine McNamara is a Cisco engineer who holds multiple CCIEs and maintains a blog at network-node.com.  She has documented step-by-step Cisco ISE configuration steps for multiple ISE versions which helped explain technical material in a way that the Cisco Learning Library and Pearson LiveLessons videos just didn’t capture as well, and made perfect write-ups to follow along with if you’re labbing.

    LabMinutes.com – Cost:  Free
    This website contains a whole suite of free videos on multiple Cisco subjects, one of which is Cisco ISE – multiple versions of it at that.  There is an option to pay for downloads but you can very easily just stream the videos you’d like on demand from their website as well.  Unfortunately, this is another resource I only found out about only shortly before my exam was scheduled, so I didn’t get to use it for its full value.  If you’re just beginning your studies for the SISE exam definitely look this one up.

    Exam Fee – Cost:  $300
    I would be remiss if I didn’t include this cost.  Fairly standard as far as Cisco exams are considered.

    In Retrospect…

    I feel like the lack of a good practice test really didn’t help me much on this exam.  I did have the SISAS practice test from Cisco Press, but there are numerous differences between the SISAS and the SISE exams – namely, the SISAS is based on ISE v1.2 and SISE is based on ISE v2.4.

    There were also practice test questions included with the Cisco Learning Library Course, but I don’t feel like their difficulty was anywhere near what I encountered on the real exam.  The conceptual questions, sure, but not the specific configuration-based questions.

    Another opportunity for improvement on my part would have been labbing the principles I’m not familiar with.  I did download a trial version VM of ISE from Cisco but I had issues with the VM and had to reinstall it several times.  I never got as far as configuring profiles, guest access, or webauth portals as I intended to do, and ultimately ran out of time.  I feel like this lack of hands-on experience with configurations I have never performed is largely what contributed to my poor exam results.

    What’s Next?

    Now that I’ve passed the SISE exam – by the skin of my teeth – the only thing left to do is take on the SCOR exam.  In this case, luckily the SCOR book from Cisco Press is already available for purchase, so I shouldn’t have to try and reverse engineer the exam topics based on five year old material like I did with SISE.  There also seems like there’s a lot of carry-over in material from the IINS exam that I failed in February, which should hopefully make things easier for me before October.

    Here’s to hoping, anyway…

  • Cisco ISE 2.x: MAC Authentication Bypass (MAB)

    MAC Authentication Bypass (MAB) is a method of network access authorization used for endpoints that cannot or are not configured to use 802.1x authentication.  MAB uses the hardware address (MAC address) of the device connecting to the network to authenticate onto the network.

    This hardware-based authentication happens when a device connects to a Network Access Device (NAD) either wired or wirelessly – i.e., a switch, wireless access point, or VPN concentrator.  In this article I will be assuming that the NAD being used is a switch.

    Packets that are sent before MAB occurs and packets that are used to learn the MAC address are dropped by the switch.  Almost any packet can be used for MAB, but there are specific types of packets that cannot be used.  These include LLDP, spanning tree, and DTP packets.

    Once the switch learns the MAC address of the device attempting to connect to the network, the switch builds a RADIUS Access-Request packet using the MAC address of the device as the User Name and Calling-Station-ID.

    ISE then uses the MAC address from this RADIUS Access-Request packet to query its endpoint identity database for a match.  If a match is found, ISE returns an Access-Accept authorization to the switch and the device is allowed onto the network with a specific VLAN ID tag as configured by the ISE endpoint identity profile.

    If there is no matching endpoint identity in ISE, then the device is authentication session is put into an Unauth state and packets from that device are dropped by the NAD.

    Prerequisites

    In order for MAB to function, the switch must be configured to use the ISE server(s) for RADIUS authentications.  This configuration is outside of the scope of this article, and it is assumed that this configuration has already taken place.

    If issues are discovered with all MAB authentication on a specific switch, it may be best to troubleshoot the RADIUS configuration before troubleshooting MAB.

    MAB Host Mode Options

    There are four host mode options which can be used by MAB:

    Single-Host Mode:  MAB configured in single-host mode will allow only a single device to be allowed onto the network at a time.  If multiple devices are detected on the switchport, the switch will put the switchport into an err-disabled state.

    Multidomain Authentication Host Mode:  This host mode was created specifically for IP telephony.  Multidomain authentication allows one device to connect to each of the two switchport domains – one device can connect to the DATA domain, and one device can connect to the VOICE domain.

    Multi-Authentication Host Mode:  Multiple hosts are individually authenticated onto the network.  This host mode is used when there are multiple devices connecting to a single shared switchport through a hub or bridge such as an unmanaged switch.  Authorized devices are allowed onto the network as normal; packets from unauthorized devices are dropped and the switchport remains in the connected state.  This allows each device to be granted a specific VLAN ID according to its endpoint identity profile configured in ISE.

    Multihost Mode:  The first device to the network will be submitted to ISE for authentication.  If that device is authenticated, then the switchport will allow multiple other devices to access the network without requiring separate authentication of each device.  All connected devices will share the VLAN ID of the authenticated device.

    Typical Interface Configuration

    The standard interface configuration for deployments is as follows:

    mab
    authorization order dot1x mab
    authorization host-mode multi-auth
    authorization port-control auto

    Broken down, each of these commands accomplish the following:

    mab:  This command enables MAB on the interface.

    authorization order mab:  Establishes the order of authentication types to use.  Because MAB is typically used as a failover from 802.1x authentication, it is listed second.

    authorization host-mode multi-auth:  Specifies that MAB should use the multi-authentication host mode which allows multiple devices to authenticate onto the network each with its own VLAN ID.

    authentication port-control auto:  Turns on authentication for the switchport.

    Troubleshooting MAB

    Verify MAB status of an interface from the command line:

    show interface status | include [xyz]:  Confirm that the interface shows as connected.

    show interface status err-disabled:  If the interface shows err-disabled, this command will display the reason the interface is disabled.  This could be caused by issues such as single-host mode MAB with multiple devices connected or bpduguard.

    show run interface [xyz]:  View the interface configuration to ensure that the MAB commands are in place and complete.

    show mac address-table interface [xyz]:  Verify that the switchport has learned a MAC address for the device.  Note:  if the connected device has an Unauth session, you may not see a MAC address with this command.

    show authentication sessions interface [xyz]:  View the current authorization table for an interface.  This will display all MAC address learned by the interface as well as an Auth/Unauth status for each.

    show device tracking database interface [xyz]:  This command (specific to newer IOS versions) will display the MAC address and IP address of a connected device if device tracking is configured on the interface.  Some connection issues can be caused by a mismatch between a device with a static IP configured for a specific VLAN that does not match with the ISE endpoint identity profile.  This can also verify for VLANs with DHCP if the device has been unable to negotiate an IP address with its DHCP server by showing an APIPA address (i.e., 169.254.x.x).

    show ip device-tracking interface [xyz]:  Same command as above, but used for older IOS versions typically found on chassis-based switches.

  • Wireshark Fundamentals: Setup and Configuration

    Wireshark Fundamentals: Setup and Configuration

    Wireshark is an open-source tool which is used to perform packet capture and analysis for wired or wireless network traffic.  It can be intimidating to look at the first time you open a packet capture file (or pcap).  Hopefully this introduction will help smooth the sharp edges on learning this tool.

    I was first introduced to network traffic analysis using Wireshark at a workshop taught by Brad Duncan during BSides Austin in 2019.  Brad maintains a website – Malware-Traffic-Analysis.net – where he posts tutorials on Wireshark as well as pcap files of real malware and ransomware infection network traffic.

    It’s important that I mention Brad Duncan here specifically because the first task is to set up the Wireshark display.  Brad has written several articles on this topic, and I did learn his preferred setup during the workshop I attended, so most of my preferences do stem from that experience.  There’s only a finite number of ways to configure Wireshark, especially for wired ethernet pcap files, and Brad’s method works very well.

    The only major difference between my preferences and Brad’s is that I choose to keep the packet number column.  I have personally found this column helpful when working on CTF challenges or when collaborating with another person to review a packet capture file.  (i.e., “Hey, can you check out packet 456 on file xyz? I think this might be C2 traffic.”)

    Once you understand the basics of configuring your display, it’s easy to create new profiles for specific use cases – such as if you’re investigating wireless traffic and want to see SSIDs or channel numbers listed, or if you’re investigating something that requires a specific set of custom fields such as HTTP host information.

    Summary of Instructions

    Install Wireshark:

    • Download Wireshark from wireshark.org/download.html.
    • Install the application; accept all default options and continue through each prompt until the installation is complete.
      • The installer will eventually ask if you would like to install USBPcap; it is not needed for anything covered here.
    • During the Npcap installation you will be presented with another list of options.  For now, click Install with nothing selected.
    • Once the installation is complete, launch the application to continue on with these configurations.

    Create a Configuration Profile:

    • On the top menu bar, navigate to Edit > Configuration Profiles to open the Configuration Profiles window.
    • Click the + (plus symbol) button to add a new profile entry.
    • Type a name in for your configuration profile.
      • What you name your profile is ultimately up to personal preference; I named mine 802.3 Wired Ethernet (unresolved).
    • Click OK to close the Configuration Profiles window.

    Configure Wireshark Column Displays:

    • Double-click one of your listed network adapters to open the packet inspection window, then immediately click the red square at the top left to stop packet capture.
    • Right click on any one of the display columns.
    • Click on Column Preferences…
    • Remove unnecessary columns:
      • Select the column entry titled Protocol, then click the
        – (minus symbol) button to remove it.
      • Select and remove the column entry titled Length.
    • Configure the Source columns:
      • Double-click and rename title Source to Source IP.
      • Double-click type Source address and change drop-down to Src addr (unresolved).
      • Use the + (plus symbol) button to add a new column entry with title Src Port and type Src port (unresolved).
      • Click and drag the new Src Port column field to just below Source IP.
    • Configure the Destination columns:
      • Double-click and rename title Destination to Destination IP.
      • Double-click type Destination address and change drop-down to Dest addr (unresolved).
      • Use the + (plus symbol) button to add a new column entry with title Dest Port and type Dest port (unresolved).
      • Click and drag the new Dest Port column field to just below Destination IP.
    • Click OK to exit the Preferences window.
    • On the menu bar, navigate to View > Time Display Format, then click UTC Date and Time of Day.

    Columns and Their Considerations

    Number

    The No. column is supremely useful for two things:

    • Referring to specific packets in a given capture file; and
    • Sorting packets back into the order of capture.

    I have never personally run into an instance where sorting by time/date has given me a reason for concern versus sorting by packet number, but a couple of blogs I looked at as I was drafting this article mentioned it, so I assume that this happens to people who use Wireshark for troubleshooting a lot more than I do.

    The real reason I insist on keeping this column is for collaborative use.  Very recently I participated in an OpenSOC event from Recon InfoSec where, during one of the challenges, my teammate was presented with a pair of pcap files as part of a reversing challenge he was working on.  One of the flags was to discover the first packet of command and control (or C2) traffic.  When he asked me to take a look at the files, I was able to identify what I thought was a good candidate, and give him the exact packet number so that he could take a look at what I was seeing.

    Date and Time

    Wireshark uses Seconds Since Beginning of Capture as its time display by default, which is honestly next to useless for any kind of corroboration against other datasets – or even retrospective analysis if you save a pcap file for later.  

    There are two great options for how to configure this:

    • Use UTC Date and Time of Day, which is my usual default; or
    • Date and Time of Day (without the UTC).

    As you can probably guess they are two sides of the same coin.  I don’t do a lot of my own packet captures; typically I’m looking at someone else’s pcap file, so the absolute local time doesn’t usually matter to me very much.  UTC time is something I’ve grown comfortable with seeing simply from other facets of IT work.

    In either case, Wireshark uses the system kernel of the machine capturing the traffic as the time source so it is important when capturing critical data to ensure that your system time is synchronized to an accurate source.  You can also switch between UTC and non-UTC display at any time on a given pcap file if it is pertinent to your investigation.

    There is an option in this same window to configure the granularity of the timestamps (seconds, tenths of a second, hundredths of a second, etc.) but in most cases you can leave this selection on the default setting — Automatic (from capture file).  For brevity’s sake it can clean up your display to use Seconds instead.  If you’re getting to the point where this matters for anything other than personal preference then you’re probably beyond the scope of this article anyway.

    Source and Destination IPs/Ports

    Even though Wireshark does show the source and destination IPs for captured packets by default, I find it incredibly useful to include the source and destination port numbers as well.  In cases where there is no layer 3 traffic (such as ARP), these fields will display MAC addresses instead, so you can still understand the source and destination traffic.

    In this article I have specified the use of unresolved IP addresses and port numbers.  Depending on your needs, it may make sense to set these to resolved. I’ve made myself both a resolved and an unresolved profile so that I can switch between the two as needed.

    One thing to keep an eye out for with resolving port numbers to a well-known name is that, sometimes, that traffic over UDP port 53 is not actually DNS traffic.  In one CTF that I participated in, the hostile C2 traffic was egressing the LAN from a random ephemeral port as you might expect, but the packet was an HTTP GET request of an obfuscated string to a remote IP over port 80.  Wireshark can’t always intelligently decode non-typical traffic like that and assign a resolved port name correctly.

    References

    Changing the Column Display in Wireshark  | Brad Duncan’s Malware Traffic Analysis
    https://www.malware-traffic-analysis.net/tutorials/wireshark/index.html

    Customizing Wireshark — Changing Your Custom Display  | Brad Duncan for Palo Alto Networks Unit 42 Blog
    https://unit42.paloaltonetworks.com/unit42-customizing-wireshark-changing-column-display/

    Wireshark Column Setup Deepdive  | Jasper at Packet-Foo
    https://blog.packet-foo.com/2018/08/wireshark-column-setup-deepdive/comment-page-1/

    SharkTIPS! My Favorite Wireshark Customizations (Part 1)  | Eddie Forero’s Bad-fi Blog
    https://badfi.com/blog/2017/5/16/sharktip-1

    Wireshare User Guide 7.6 – Time Stamps  | Wireshark.org
    https://www.wireshark.org/docs/wsug_html_chunked/ChAdvTimestamps.html