
Tag: Incident Response

  • An Introduction to Threat Hunting

    An Introduction to Threat Hunting

    In cybersecurity, some of the most interesting work happens outside of responding to alerts or blocking connections. It’s in the quiet work of studying how attackers operate, learning from breaches reported by others, and digging into your own data to uncover things your monitoring tools may have missed.

    That’s what threat hunting is about: going on the offensive to find the adversary who may already be in your environment, looking for their next payday.

    What Do I Mean by “Threat Hunting?”

    Think of your network like your home. Locks on the doors and windows (firewalls, antivirus, IDS) stop most intruders. But a skilled burglar might pick a lock, slip in through an unlocked window, or even walk in with a stolen key. Once inside, they don’t smash things – they move quietly, rifling through drawers and leaving little trace.

    Threat hunting fills that gap. Instead of waiting on alerts, hunters build hypotheses about how an adversary might behave and then actively test those ideas against available data. It is structured, data-driven work focused on behaviors rather than signatures.

    More importantly, threat hunting is a mindset: one that values curiosity, persistence, and the willingness to question assumptions. Every hunt – whether it uncovers malicious activity or not – improves understanding of your environment and strengthens defenses against evolving threats.

    Key Concepts: IOCs and TTPs

    When starting out in threat hunting, you’ll quickly run into two foundational terms: Indicators of Compromise (IOCs) and Tactics, Techniques, and Procedures (TTPs). Understanding the difference is critical because it shapes how you hunt.

    Indicators of Compromise (IOCs):
    IOCs are the digital “breadcrumbs” adversaries leave behind. They can be:

    • File hashes of known malware samples
    • IP addresses used as command-and-control (C2) endpoints
    • Domains or URLs linked to phishing kits
    • Registry keys or filenames associated with persistence mechanisms

    These are valuable for detection because they’re concrete and easily matched in data. But the downside is that they’re also fragile. An attacker can recompile malware to change the hash, spin up a new IP, or register a fresh domain in minutes. IOC-driven hunting often turns into a game of whack-a-mole.

    Tactics, Techniques, and Procedures (TTPs):
    TTPs are the behaviors of adversaries, and they map directly into frameworks like MITRE ATT&CK. They operate on three levels:

    • Tactics: The why – the adversary’s goal (e.g., initial access, lateral movement, privilege escalation).
    • Techniques: The how – specific methods to achieve the goal.
    • Procedures: The details – the exact commands or scripts used (e.g., running procdump -ma lsass.exe).

    TTPs are more resilient for defenders to focus on. While an attacker can swap an IP address instantly, they can’t as easily abandon their need to dump credentials, move laterally, or persist in an environment. Hunting for TTPs means you’re looking at the behaviors that underpin the attack itself, not just the exhaust it leaves behind.

    The PEAK Framework

    Threat hunting isn’t about running random queries until something looks suspicious – it requires structure. One practical framework for approaching hunts is PEAK: Prepare, Execute, and Act with Knowledge.

    via PEAK Threat Hunting Framework on GitHub
    • Prepare:
      This phase is about defining what you’re hunting for and building context. It starts with a hypothesis. For example:
      • Hypothesis: “Attackers may be using unauthorized remote administration tools on endpoints.”
      • Supporting knowledge: Remote tools like AnyDesk or TeamViewer might show up in process creation logs or network traffic.

    Preparation also means understanding your data. Which logs do you have? Where are the blind spots? What does “normal” look like for your environment? Without a baseline, you won’t recognize the anomalies.

    • Execute:
      This is the investigation phase. You translate your hypothesis into queries and search across your data sources. The goal is not only to confirm or refute your hypothesis but also to learn more about the behaviors in your environment.
    • Act with Knowledge:
      Once you’ve executed your hunt, you need to turn findings into action:
      • Escalate confirmed activity to incident response.
      • Write new detection rules or dashboards.
      • Document baselines and anomalies.
      • Share findings with your team to improve collective knowledge.
      • Even a hunt that turns up nothing isn’t wasted – knowing that certain activity is not happening is valuable context for future hunts.

    Types of Hunts

    There are three common styles of hunts, each serving a different purpose:

    • Hypothesis-driven:
      Starts with a focused question. Example: “Are attackers attempting to brute-force service accounts?”
      • These hunts are great for validating intelligence or testing assumptions about adversary behavior.
      • They often rely on known TTPs and can be directly mapped to MITRE ATT&CK.
    • Baseline (exploratory):
      Focuses on establishing what “normal” looks like in your environment, then flagging deviations.
      • Example: A user who typically logs in between 8am–6pm suddenly authenticates at 3am.
      • This type of hunting is especially useful in environments with little historical visibility – it builds the foundation for later hunts.
    • Model-assisted (statistical/machine learning):
      Uses anomaly detection, clustering, or statistical baselining to highlight suspicious activity.
      • Example: Detecting unusually long network sessions that may indicate data exfiltration.
      • While these hunts can uncover subtle threats, they require clean data and careful interpretation – false positives are common if the models aren’t tuned.

    A mature hunting program blends all three: hypothesis-driven hunts to test specific threats, baseline hunts for context, and model-assisted hunts to scale beyond what humans can do alone.

    The Pyramid of Pain

    David Bianco’s Pyramid of Pain is a visual model that explains how much “pain” you impose on attackers when you detect and respond at different levels of indicators.
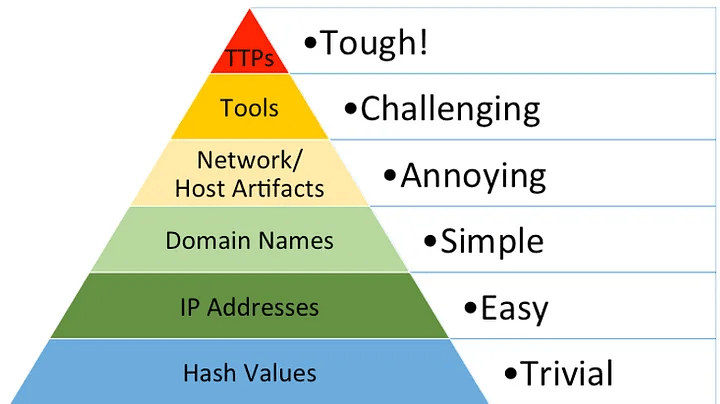
    via David Bianco’s Pyramid of Pain
    • Hashes: Lowest level. Blocking a malware hash is trivial for attackers to bypass – recompile and move on.
    • IP Addresses: Slightly more effort, but attackers can rotate infrastructure or use VPNs/CDNs.
    • Domains: Harder still – new registrations and DNS updates take more time and money.
    • Network/Host Artifacts: Observable patterns such as unusual URI paths, command-line arguments, or registry modifications. Altering these requires real operational changes.
    • Tools: Blocking tools like Cobalt Strike or Mimikatz forces adversaries to acquire or build alternatives, costing significant effort.
    • TTPs: The top of the pyramid. Detecting behaviors like credential dumping, lateral movement, or data staging forces attackers to completely rethink how they operate.

    The closer your hunts get to the top of the pyramid, the more resilient your detections become. IOC hunts at the bottom are quick but shallow. TTP hunts at the top are harder, but they impose maximum cost on adversaries and give defenders the longest-lasting advantage.

    What Next?

    Threat hunting isn’t about waiting for alarms to sound – it’s about taking the initiative to uncover adversary behavior before it turns into an incident. By understanding the difference between IOCs and TTPs, applying a structured approach like the PEAK framework, and aiming your hunts higher on the Pyramid of Pain, defenders can shift from reactive response to proactive detection.

    Hunting sharpens both technical skills and organizational defenses. Even when a hunt doesn’t uncover active compromise, it adds valuable knowledge about what “normal” looks like in your environment and where your blind spots may be. Over time, that knowledge translates into stronger detections, faster response, and more resilient defenses.

    This post introduced the foundations of hunting – why it matters, the concepts that guide it, and the frameworks that shape it. In part two of this series, I’ll expand on where to find IOCs and TTPs, and show how to apply them in practical hunts. We’ll walk through basic hunting examples to demonstrate how these concepts come together in real-world analysis.

  • Windows Forensics: Prefetch 101

    Windows Forensics: Prefetch 101

    While attending the annual Texas Cyber Summit recently, I watched a talk by Marcus Guevara of Recon Infosec titled “The Best Free Resources to Get Started in Incident Response.”  One of the things he mentioned in that talk is Windows Prefetch – something already built into Windows by default.

    I had never heard of Prefetch before this talk but the premise was really interesting.  Using information that is available within Prefetch, you can begin to establish a timeline of application usage (up to an extent) on a Windows system.

    My mind immediately went to a recent issue I investigated where a spear phishing attack successfully convinced several members of senior management to not only open an email and click on a link, but also download and open a PDF file.  I also thought back to several past incidents where users had encountered the classic virus scam pop-up, trying to convince them that their system was infected.

    I come from a networking background so my first inclination is usually to look at our firewall or our SIEM to see what IPs are connecting to and from the system.  Next I usually look at Windows event logs from that system – again through the SIEM.  Using Prefetch information, though, it sounded like I would be able to gain additional insight directly from the endpoint itself.

    What Even Is Prefetch Anyway?

    Prefetch was introduced back in ye olden times with the release of Windows XP in the year 2001.  (If you are reading this and you remember when Windows XP was released, please remember to stand up and move around every once in a while before your back locks up…like mine will shortly.)

    The purpose of Prefetch was to speed up the boot-up of the system and reduce the amount of time it took applications to load.  It does this by storing some basic information about the resources needed by commonly-used executable binaries run on the system into a file so that those resources can be pre-emptively loaded into memory before they are needed.

    Side note:  Within the context of this article, I am referring exclusively to Windows Prefetch.  Prefetch as a concept is used in several other contexts throughout other environments (such as software engineering), and I won’t be referencing any of those here.

    Configuring Prefetch

    The configuration for Prefetch is accomplished with a key value stored in the following Windows registry hive:

    HKEY_LOCAL_MACHINE\SYSTEM\CurrentControlSet\Control\Session Manager\Memory Management\PrefetchParameters

    The default configuration for the EnablePrefetcher key is 3.  This enables Prefetch for both boot-up and application use.  You can modify the behavior of Prefetch by double-clicking on EnablePrefetcher and changing the Value data field to one of the following values:

    0Disables Prefetch entirely
    1Enables Prefetch for applications only
    2Enables Prefetch for boot-up only
    3 (default)Enables Prefetch for both boot-up and applications

    What and Where Are Prefetch Files?

    When Windows creates a Prefetch file, that file is saved to the %systemroot%/Prefetch folder (the common literal path for this is C:\Windows\Prefetch).  You can quickly reach this location by opening a Run window by pressing the Windows key + R, then in the Open: field type in prefetch and click OK.

    These files have a .pf file extension and are stored in an encrypted format, so they are not immediately readable with something like Notepad – they have to be opened with specific tools.

    Beginning with XP, Windows was able to store up to 128 Prefetch files.  Once Windows 8 came along this number was upped to 1,024 Prefetch files.  Once that limit is reached, Windows will automatically delete files from the Prefetch folder.

    The name of each Prefetch file will begin with the name of the binary as well as an eight-character hash of the location where the file was executed from.  As an example, here are a few Prefetch file names from my system:

         CHROME.EXE-5A1054B7.pf
    CMD.EXE-4A81B364.pf
    NOTEPAD.EXE-D8414F97.pf

    You may notice that some applications have multiple different files with very similar hash strings.  There are a few reasons why this might happen.

    One of the possible causes for this is due to the fact that this hashing function is actually a two-part process.  The first hash that is generated is based on the full file path of the binary – i.e., C:\Windows\System32\rundll32.exe – which is converted into a unicode string to which the first  hashing function is applied.

    The second hashing function is calculated based on the case-sensitive file path and command line string (including arguments) that the binary is being run with.  This is very likely the source of the discrepancy.  Running CMD.exe will produce a slightly different hash than, say, cmd.exe or even Cmd.exe.

    It may also be that a binary with the same name is running from a different location, such as C:\temp.  This could be a sign of something malicious running on the system.  Aside from decrypting the file itself or running a script to reverse the hash, there also exists a pre-generated lookup table of Prefetch hashes which is available from the Hexacorn blog here.

    Prefetch File Contents

    Given that Prefetch files are intended to reduce the amount of time that it takes for applications to load, you probably wouldn’t be surprised to learn that they contain a list of directories and files referenced by a given executable, with their full file paths.

    Slightly more useful, though, is metadata on the executable itself – its file size, creation date, modified date, date last accessed, date last run, an eight-character hash, and the number of times the executable has been run.

    Below is an example of a Prefetch file that I got off of a fresh Windows 11 virtual machine that I spun up for this:

    Created on: 2023-10-22 02:53:06
    Modified on: 2023-10-22 02:53:06
    Last accessed on: 2023-10-22 02:54:00

    Executable name: NOTEPAD.EXE
    Hash: 2486F8A8
    File size (bytes): 128,820
    Version: Windows 10 or Windows 11

    Run count: 1
    Last run: 2023-10-22 02:53:04

    Volume information:

    #0: Name: \VOLUME{01d9eb913362ed3f-2c339f40} Serial: 2C339F40 Created: 2023-09-20 07:08:04 Directories: 39 File references: 198

    Directories referenced: 39

    00: \VOLUME{01d9eb913362ed3f-2c339f40}\PROGRAM FILES
    01: \VOLUME{01d9eb913362ed3f-2c339f40}\PROGRAM FILES\WINDOWSAPPS
        *** Output omitted for brevity ***
    37: \VOLUME{01d9eb913362ed3f-2c339f40}\WINDOWS\SYSTEM32\EN-US
    38: \VOLUME{01d9eb913362ed3f-2c339f40}\WINDOWS\WINSXS\AMD64_MICROSOFT.WINDOWS.COMMON-CONTROLS_6595B64144CCF1DF_6.0.22621.2215_NONE_270D72677387DFC3

    Files referenced: 142

    00: \VOLUME{01d9eb913362ed3f-2c339f40}\WINDOWS\SYSTEM32\NTDLL.DLL
    01: \VOLUME{01d9eb913362ed3f-2c339f40}\WINDOWS\SYSTEM32\C_1252.NLS
        *** Output omitted for brevity ***
    140: \VOLUME{01d9eb913362ed3f-2c339f40}\WINDOWS\SYSTEM32\WINDOWS.UI.CORE.TEXTINPUT.DLL
    141: \VOLUME{01d9eb913362ed3f-2c339f40}\WINDOWS\SYSTEM32\TWINAPI.DLL

    Tools for Analyzing Prefetch Files

    One of the most widely-recommended tools for working with Prefetch files is called Prefetch Explorer Command line (PECmd) by Eric Zimmerman.  PECmd is a command line tool (I bet you never would have guessed that by the name) which is extremely useful for processing .pf extension files.  You can use PECmd to parse single files or entire directories, and you can output the results of this to multiple formats such as JSON, HTML, and CSV for analysis in other tools.

    Another tool that I’ve found is WinPrefetchView from NirSoft.  This offers a graphical pointy-clicky interface for those who aren’t yet as comfortable with command line tools.  Just like PECmd, WinPrefetchView can work with either individual files or entire directories, and you can also save your outputs into other formats – in this case XML, CSV, and HTML.

    References

    What Are Prefetch Files in Windows?  Are They Important?  |  The Tech Advocate
    https://www.thetechedvocate.org/what-are-prefetch-files-in-windows-are-they-important/

    Prefetch Files in Windows  |  Geeks for Geeks
    https://www.geeksforgeeks.org/prefetch-files-in-windows/

    Prefetch Hash Calculator + a hash lookup table  |  Hexacorn
    https://www.hexacorn.com/blog/2012/06/13/prefetch-hash-calculator-a-hash-lookup-table-xpvistaw7w2k3w2k8/

    PECmd  |  Eric Zimmerman
    https://github.com/EricZimmerman/PECmd

    Eric Zimmerman’s Tools  |  Eric Zimmerman
    https://ericzimmerman.github.io/#!index.md

    WinPrefetchView  |  NirSoft
    https://www.nirsoft.net/utils/win_prefetch_view.html

  • Introduction to the Volatility Framework

    Recently I was very fortunate to be able to attend not only the BSides Austin conference this past weekend, but the two training days immediately preceding it.  One of the training workshops I attended was Incident Response with Volatility Framework, taught by Evan Wagner.  If you ever have the opportunity to attend this training in person, I highly recommend it. (more…)